GRAPHS: 95% CI Range of Bootstrapped Correlation Coefficients of Multiple Stats vs Win%
- Stros Talk
- Dec 8, 2022
- 1 min read

PROCESS:
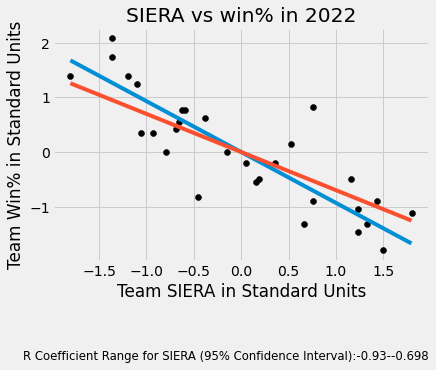
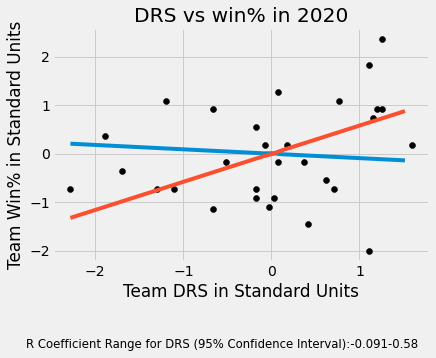
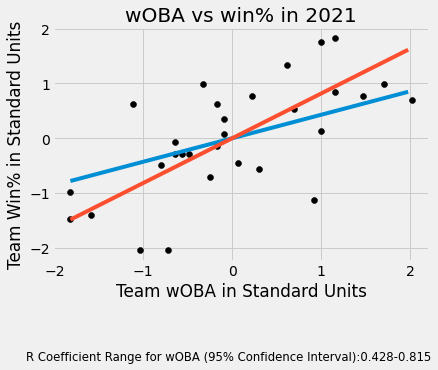
For each stat and each year, shuffle our sample 10,000 times and for each shuffle, we take the correlation between that stat and win% in Standard Units. After this we have 10,000 estimates of the true regression line and we take a 95% Confidence interval as shown by the range listed at the bottom of each graph and the two lines. The closer the absolute value of the correlation coefficient is to 1, the better correlated it is likely to be.
NOTE: For those coming from YouTube, the ranges and graphs are different from the ones in the post. This is because, to add the range into the graph itself, I had to rewrite the code and thus redo this process. Also that post only included 1000 shuffles whereas these are the results of 10,000 shuffles. The original graphs can be found on Twitter: https://twitter.com/TalkStros/status/1600693907200741376?s=20&t=DbffkMVQ8gPx5oDXKvHJ0A
ERA


Skill-Interactive ERA (SIERA)


Outs Above Average (OAA)


Defensive Runs Saved (DRS)


Weighted On-Base Average (wOBA)


On-Base Plus Slugging (OPS)


Comments